Panoramic View
Stellar Cyber provides a host-centric way to view alert activity for specific hosts, including display of a 360 Panoramic view using either of the following methods:
- Access Investigate | Panoramic, then select 360 View Panoramic from the menu on a specific tile.
- From the context menu for specific data such as in Event Details , select 360 View Panoramic.
The data on this screen is subject to the filter terms set by the tools at the top of the screen. See the Filter page for more information on working with filters.
Investigate | Panoramic
When you access Panoramic views from the Investigate menu, you have the option of examining hosts based on whether they are internal (Suspect Assets) or external (Suspect External Hosts). These tabs display a scrollable grid of cards, each of which shows the information for a single host.
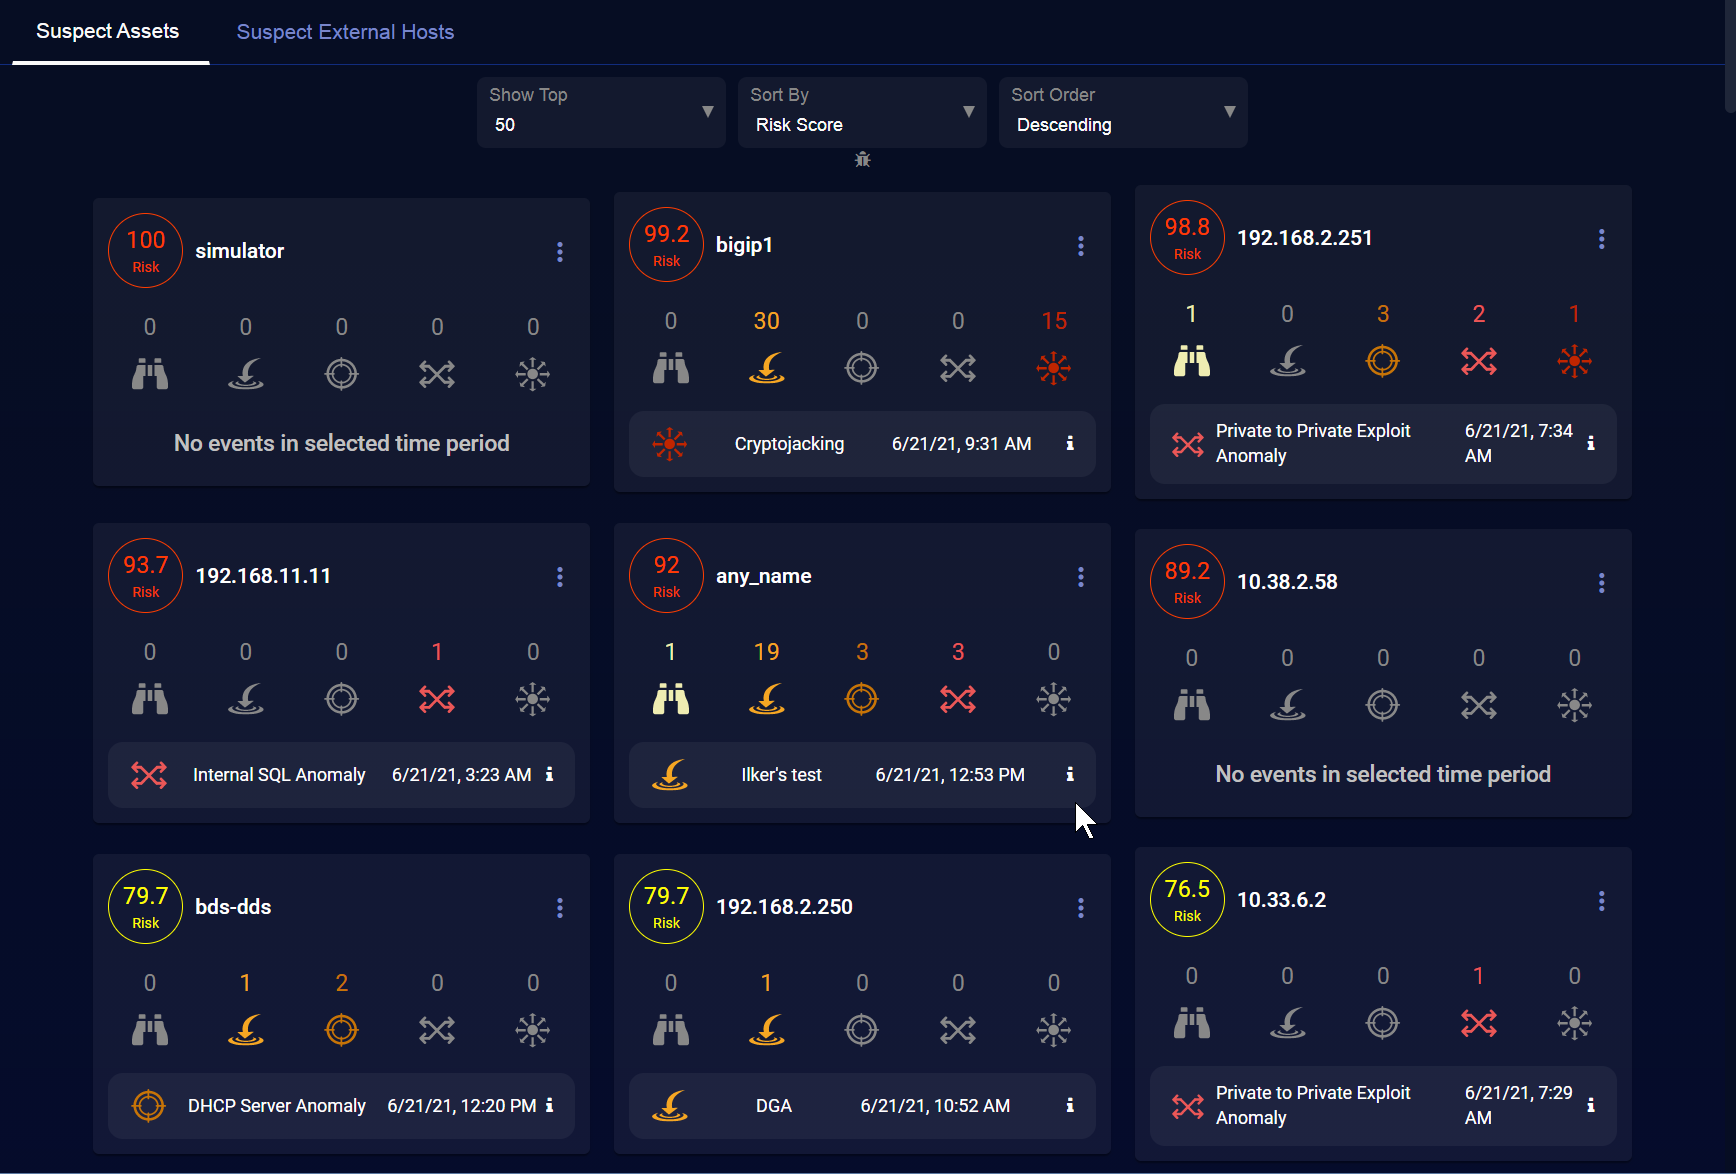
As shown in the figure below, each host is listed with the following information and context-sensitive drilldowns. Use the drilldown menu to further analyze a specific host, including drilling into a 360 panoramic view (described below).

-
Risk score. The number in the circle indicates risk. The highest risk is 100 and the least is zero.
-
IP address or hostname of the asset.
-
Context menu access
 for drilldowns to the following additional Stellar Cyber for the asset:
 -
Asset Detail View – Opens the Investigate | Asset Analytics | Asset Details tab for the selected friendly name, hostname, or IP address as the filter.
-
360 Panoramic View – Opens the Investigate | Panoramic view with the selected friendly name, hostname, or IP address as the filter.
-
ZOOM Lateral View – Opens Investigate | Threat Hunting to the ZOOM tab. The Lateral view displayed with the friendly name, hostname, or IP address as the focus.
-
ZOOM Chronicle View – Opens Investigate | Threat Hunting to the ZOOM tab. The Chronicle view displayed with the friendly name, hostname, or IP address as the focus.
The ZOOM feature is deprecated in 4.3.7 and will be removed in a future release.
-
VT VirusTotal Lookup – Performs a lookup on virustotal.com for the selected friendly name, hostname, or IP address.
-
Add as Including Filter – Creates a filter to display only those events containing the value in the field.
-
Add as Excluding Filter – Filters out those events containing the value in the field.
-
Copy to Clipboard – Copies the field value to the clipboard so it can be pasted elsewhere.
-
Related Alerts – Opens Investigate | Threat Hunting to the Interflow tab with a search performed on the corresponding entity.
-
-
XDR Kill Chain summary. Alert counts are shown for each XDR Kill Chain stage, identified using their consistent stage icons and colors. You can click any stage entry to drill to the Alerts page, filtered for the corresponding asset and Kill Chain stage.
-
A one-line summary for the most severe alert associated with the asset. You can click the button to drill to the Event Display for the alert, including the supporting Interflow data.
360 Panoramic View
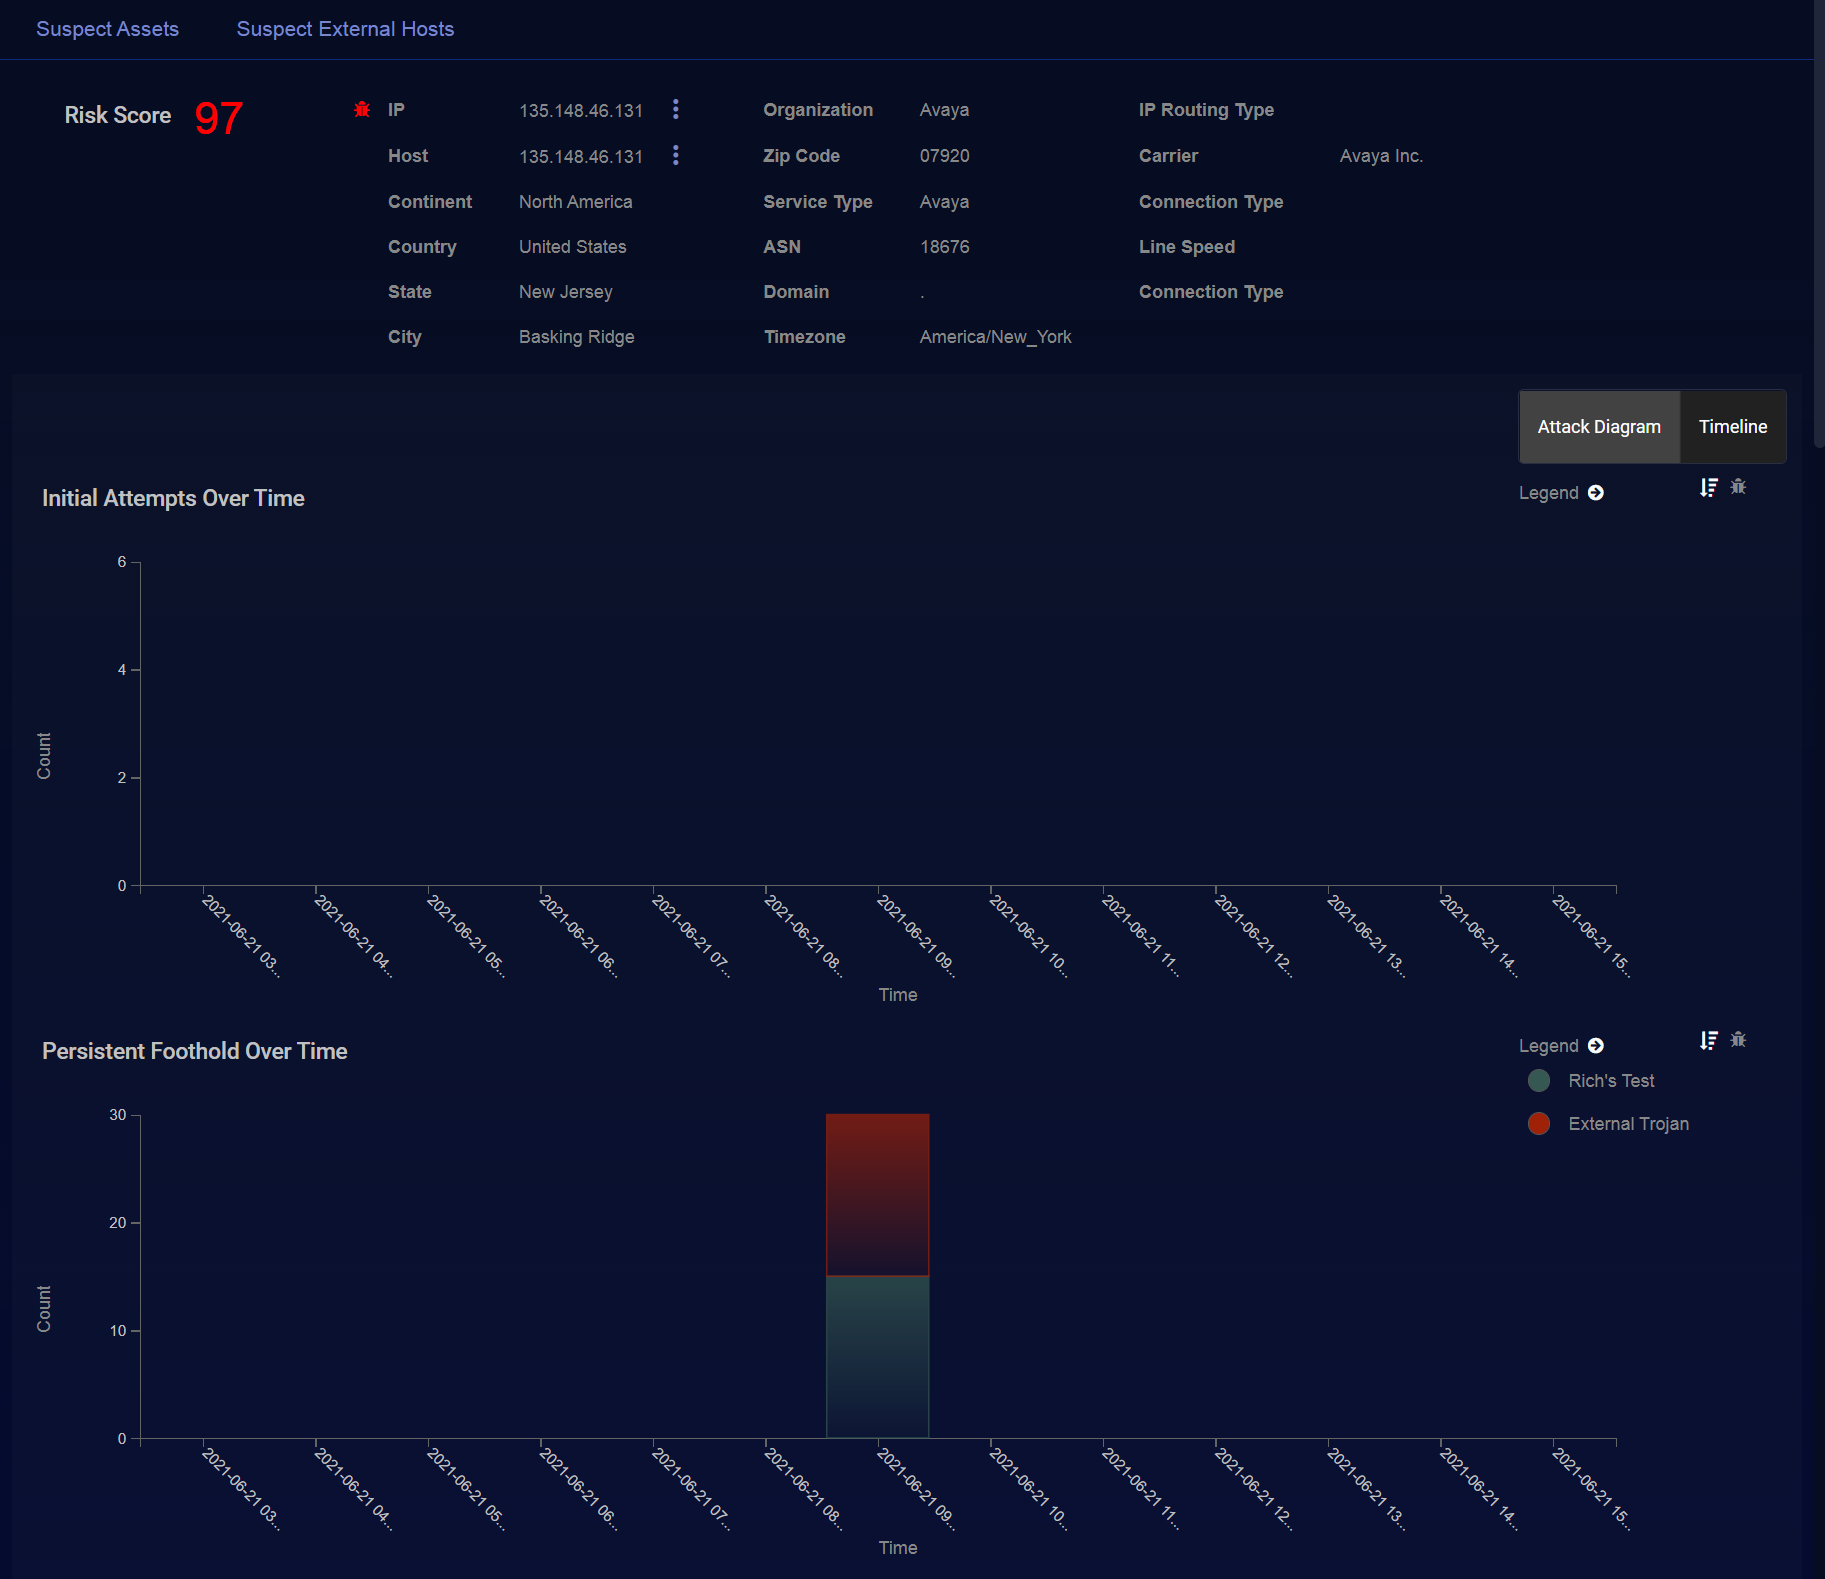
The 360 Panoramic View is an extensive summary of an individual host, including a common Header section and then separate Attack Diagram and Timeline tabs. An example of this display is shown in the following images.
The view contains the following sections:
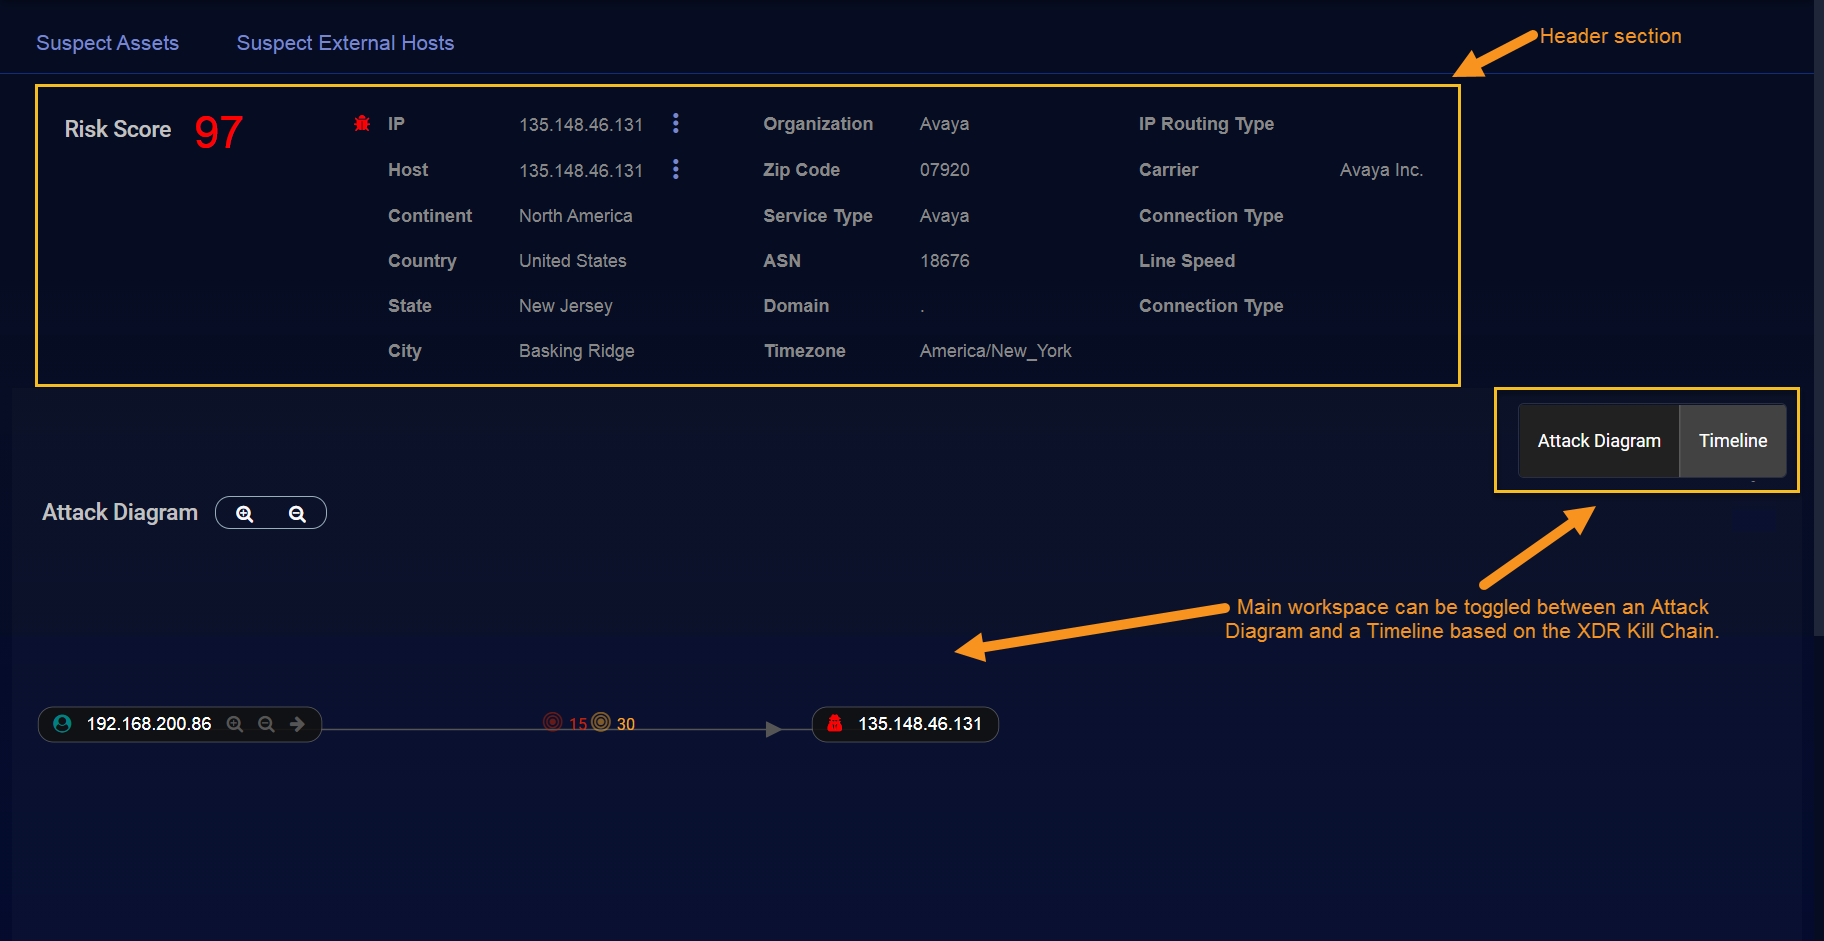
- Header—The top section holds a summary of the identity of the host. Not all fields will have values depending on the vantage points of the sensor(s) are able to collect data and also what reference information is available. The first number is the calculated risk which is the prime indicator of the display. You can use the menu to access the same IP and Host drilldowns available in the Suspect Assets summary list.
-
Attack Diagram—This appears to the right of the Kill Chain Time Sequence. It provides a connection chart that lists all (or as many as possible) hosts that are interacting with the currently selected host. The colored dots on the connection lines represent the detectors that identified the information.
Hovering the mouse cursor over the IP addresses in the Attack Diagram provides additional information on the associated host.
-
Timeline—Each stage of the XDR Kill Chain has its own time-series graph of alerts that involve this host. Each alert type is assigned its own color and mentioned in the legend.
-
Table—The bottom of the display provides a table of all the events in the data set for the host.
See the Tables page for more information on working with tables.
-